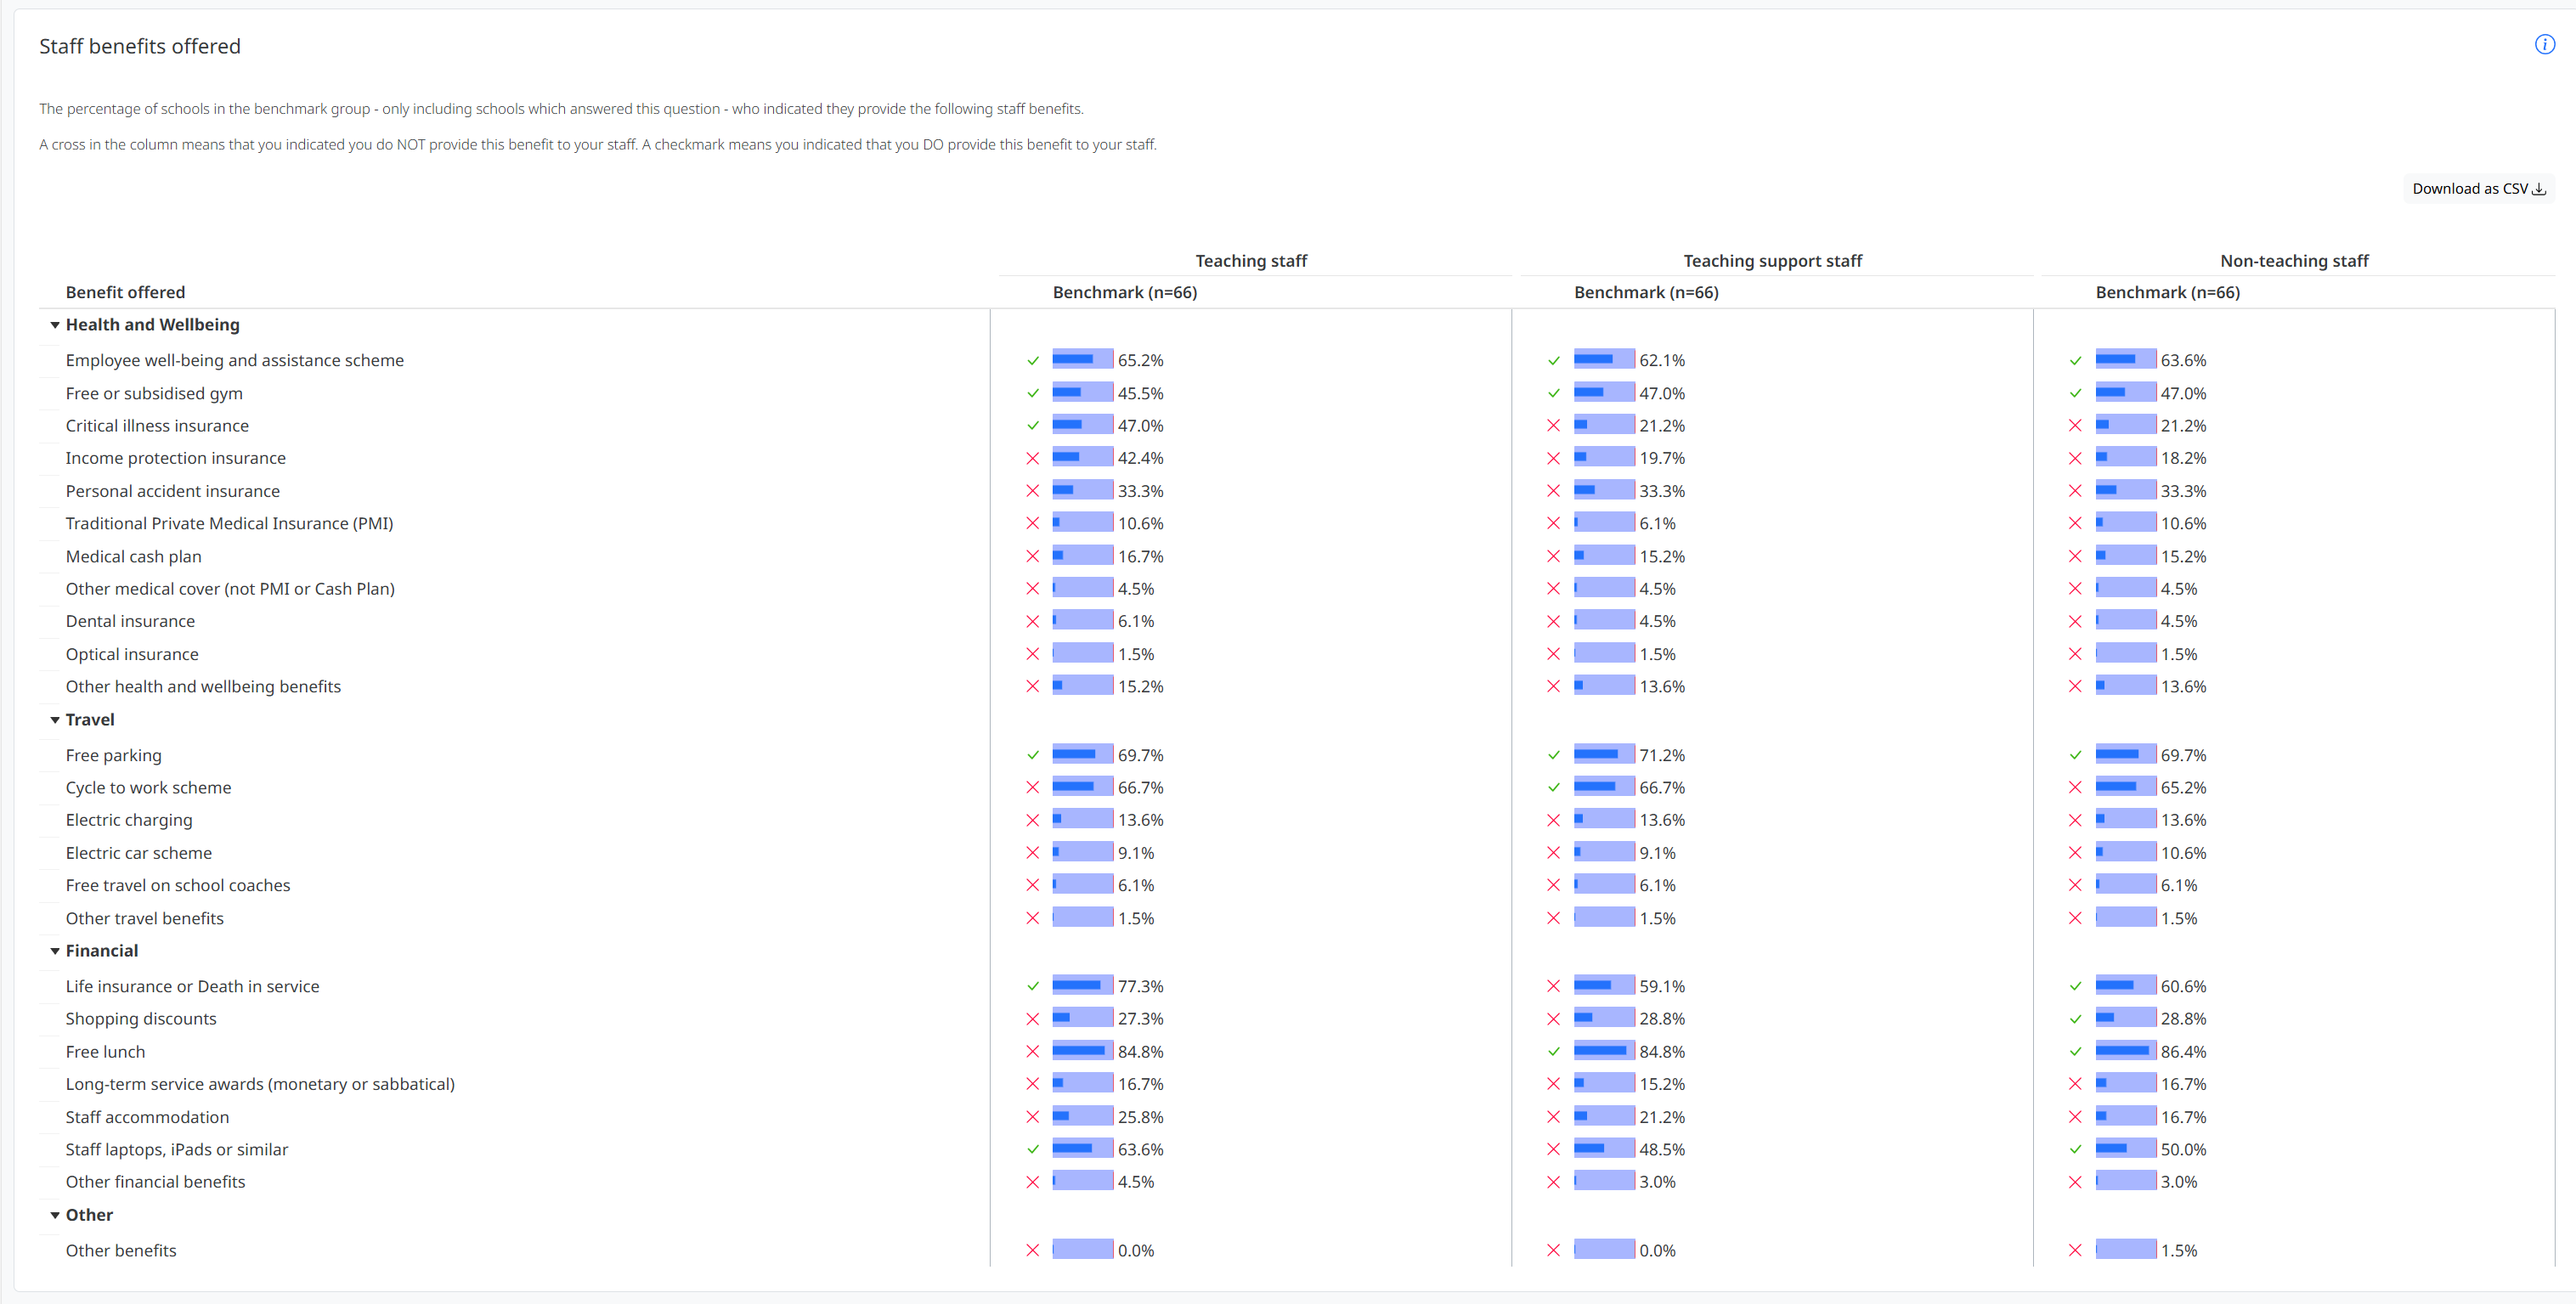
This table shows the benefits offered to staff by schools, as recorded in survey question H-01.
The number of schools in the benchmark group who responded for each type of staff can be seen in the column title (n=…). For example, if the size of the current benchmark group is 150, the Benchmark column header says (n=100), and the percentage in a row is 65%: this means that of the 150 schools in the benchmark group, 65 answered affirmatively and 35 did not. The remaining 50 schools did not answer the question at all so it is not known whether they provide this benefit to their staff.