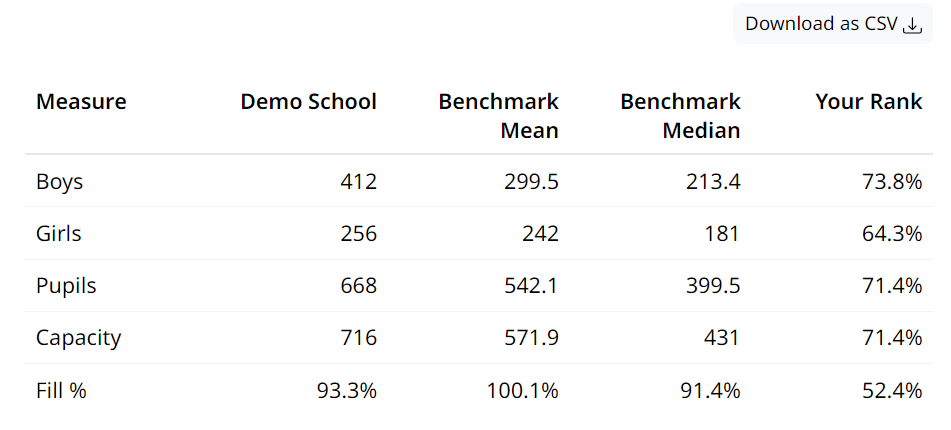
This table has five columns which show data Section B: General Pupil Information:
- Measure - the different types of pupil subsets:
Boys - the number of boys in your school, the question comes from 14. Number of pupils by gender as at 31 August
Girls - the number of girls in your school, the question comes from 14. Number of pupils by gender as at 31 August
Pupils - the total of number pupils in your school, the question comes from 14. Number of pupils by gender as at 31 August
Capacity - the total capacity for pupils in your school, the question comes from 19. What is the total full time equivalent pupil capacity for each age group as at 1 September
Fill % - shows the result of:
\[ Fill \space percentage = Pupils \space / \space Capacity \] 2. Your school’s values for each of the measures.
Benchmark mean - the benchmark mean for the each of of the measures.
Benchmark median - the benchmark median for the each of the measures.
Your rank - your school’s rank in the benchmark.

The “Download as CSV” button allows you to download the table as a comma separated values file which you can open in your spreadsheet applications.