
For general information on how to read a benchmark histogram, see here.
 For general information on how to use the plot controls, see here.
This plot shows the distributions of cost of staff with the option to look at:
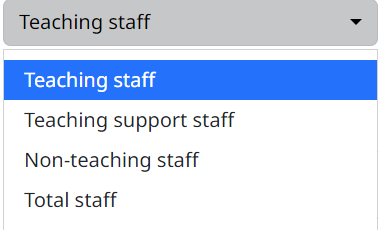
- Teaching staff
The Teaching costs from 36. What are the total staff costs for employees on the School payroll, in the previous accounting year to 31 August divided by the number of Teaching staff from 38. What was the average number of full time equivalent staff removing duplicates at the school over the previous accounting year to 31 August.
- Teaching support staff
The Teaching support costs from 36. What are the total staff costs for employees on the School payroll, in the previous accounting year to 31 August divided by the number of Teaching support staff from 38. What was the average number of full time equivalent staff removing duplicates at the school over the previous accounting year to 31 August.
- Non-teaching staff
The Non-teaching costs from 36. What are the total staff costs for employees on the School payroll, in the previous accounting year to 31 August divided by the number of Non-teaching staff from 38. What was the average number of full time equivalent staff removing duplicates at the school over the previous accounting year to 31 August.
- Total staff
The total costs from 36. What are the total staff costs for employees on the School payroll, in the previous accounting year to 31 August divided by the number of Total staff from 38. What was the average number of full time equivalent staff removing duplicates at the school over the previous accounting year to 31 August.