Tip
For general information on how to read a benchmark histogram, see here.
Tip
 For general information on how to use the plot controls, see here.
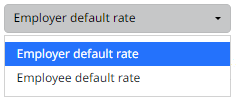
This plot shows the distributions of DC pension contributions for support staff with the option to look at:

The employer default contribution rate.
The employee default contribution rate.
These are calculated from survey question 85. What is the Support Staff’s DC default contribution structure.
