Tip
For general information on how to read a benchmark histogram, see here.
Tip
 For general information on how to use the plot controls, see here.
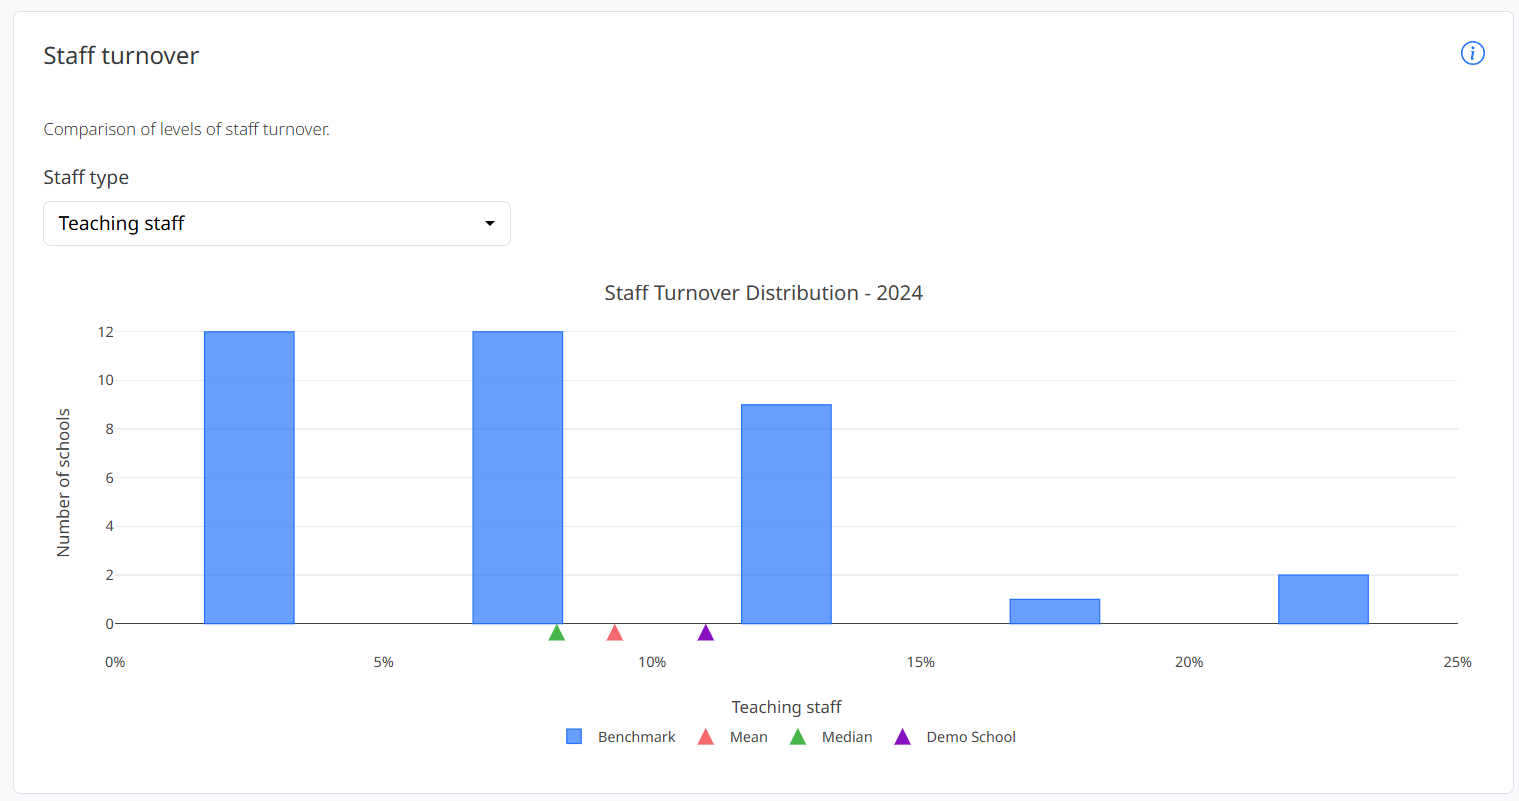
This plot shows the distribution of staff turnover, taken from survey question F-05. You can use the Staff type dropdown to filter what is shown in the graph.