Tip
For general information on how to read a waterfall plot, see here .
Tip
 For general information on how to use the plot controls, see here.
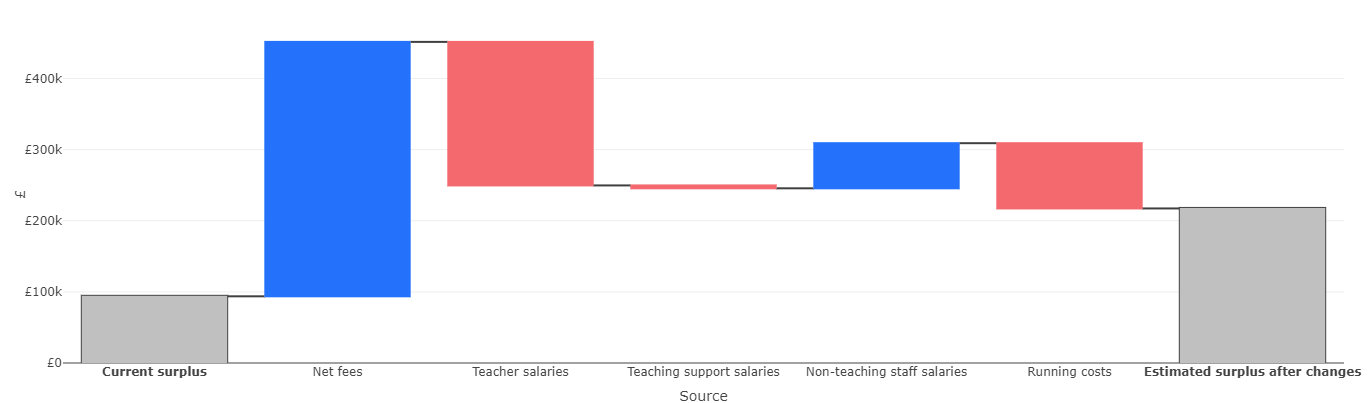
This waterfall plot shows:
the current surplus which is calculated as total income - total expenditure
the estimated monetary impact of making adjustments to selected variables which make up your school’s total surplus. The variables which can be adjusted are documented here and include:
- Gross fees
- Concessions
- Staff expenditures
- Borrowing
- Running costs
Further details on the variables can be found here
- the estimated surplus after changes is calculated as the current surplus (1) plus the sum of the adjustments made (2).
The changes made in (2) and the resulting surplus from (3) are summarised in the forecast summary table below the plot. More details on the table can be found here.