Tip
 For general information on how to use the plot controls, see here.
Tip
For general information on how to read a benchmark histogram, see here.
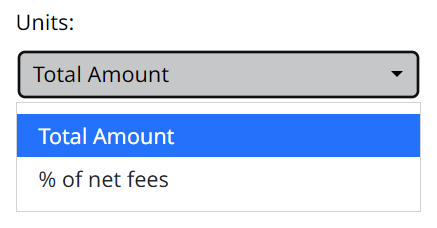
This plot shows the distribution of:
the total from survey question 35. Other income for the last accounting year to 31 August.
the total from survey question 35. Other income for the last accounting year to 31 August divided by the net fee income.
Below are the options in a dropdown

