
Tip
For general information on how to read a benchmark histogram, see here.
Tip
 For general information on how to use the plot controls, see here.
This plot shows the distributions of utilities costs with the option to look at:
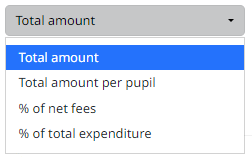
Total amount, which is the utilities costs, calculated from survey question 39. Running costs: Utilities.
Total amount per pupil, calculated as utilities costs divided by the total number of pupils. The total number of pupils is calculated from survey question 13. Number of pupils by boarding type as at 31 August.
Percentage (%) of net fees, calculated as utilities costs divided by Net fee income.
Percentage (%) of total expenditure, calculated as utilities costs divided by the total expenditure.