
Tip
For general information on how to read a benchmark histogram, see here.
Tip
 For general information on how to use the plot controls, see here.
This plot shows the distributions of teaching support staff costs with the option to look at:
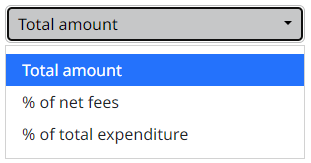
Total amount, which is the total teaching support staff costs, calculated from survey question 37. What are the total agency staff costs in GBP for those not on the schools payroll in the previous accounting year to 31 August.
Percentage (%) of net fees, calculated as total teaching support staff costs divided by Net fee income.
Expenditure per pupil, calculated as total teaching support staff costs divided by the total expenditure.