Tip
 For general information on how to use the plot controls, see here.
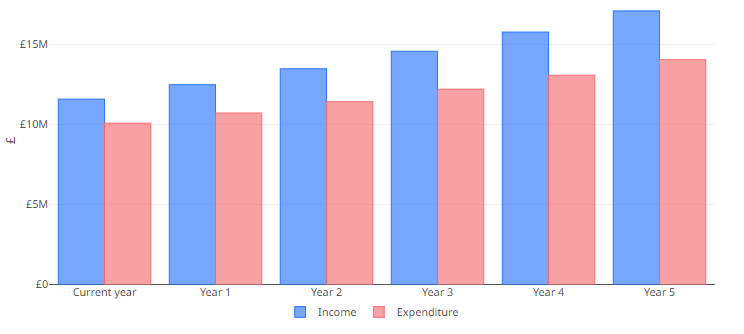
This bar chart can show either:
the total income and total expenditure for your school’s current year and each projected year
the surplus for your school’s current year and each projected year. This is calculated as total income - total expenditure.
You can switch between viewing (1) and (2) by using the drop-down above the chart.

In order to change the output of the chart use the inputs documented here and include:
- Pupil numbers
- Net fees per pupil
- Staff numbers
- Staff costs per teacher
- Borrowing
- Running costs
- Sales and marketing costs
Further details on the variables can be found here.